Passenger Rail Statistics


Raw data used to produce these reports are provided by the National Rail Passenger Corporation (Amtrak) to the Michigan Department of Transportation (MDOT).
Data are updated monthly, on the first business day following the 25th of the succeeding month (eg., January data is available after February 25th). Data are available from January 1994 to the present.
Make a report selection using the dropdown. Then select the criteria (eg., month, year, calendar/fiscal, de/boarded) to tailor the report to your needs. These reports represent the most current data when you submit your request. As audits are performed, or additional data become available, Amtrak may provide updates which will change the values reported herein.
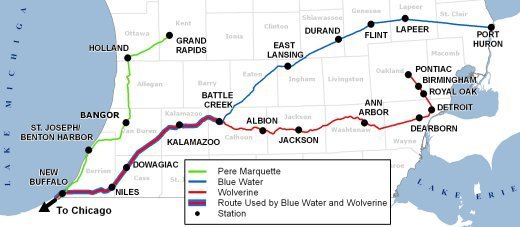
Data summaries in these reports represent all stations served by the Detroit (Wolverine), Grand Rapids (Pere Marquette) and Port Huron (Blue Water) to Chicago rail corridors; not just those in Michigan.
Passengers getting on the train (embarking) are said to be boarding, while those getting off the train (disembarking) are said to be deboarding. Boarding and deboarding are referred to as station activity.
Calendar year data will include the months of January through December for the year selected. Fiscal year data will include the months of January through September for the year selected, and October through December of the previous year.
Due to an October 1, 2003 change in data management procedures, information in this document may not match previously generated MDOT reports.
In addition, data in this report may differ from similar Amtrak reports due to differences in the way MDOT and Amtrak treat data not specifically attributed to individual stations.
Numeric rounding may result in differences in MDOT/Amtrak revenue values.
Prior to 2004, service was provided between Toronto and Chicago through Port Huron. As of April 25, 2004 this service terminates in Port Huron. Thus in the Annual Ridership Summary, Toronto-Chicago, Toronto/Port Huron-Chicago and Port Huron-Chicago, all refer to the same corridor.